Climate Matters•January 17, 2024
Billion-Dollar Disaster Seasons
KEY CONCEPTS
The U.S. was hit with a record 28 billion-dollar weather and climate disasters in 2023 — part of a rising trend in disaster frequency and costs.
Nationwide, tropical cyclones are the most costly type of billion-dollar disaster, and severe storms are the most frequent. Each U.S. region faces a different set of disaster risks each season.
Billion-dollar severe storms and floods are generally most common during spring, especially in the Upper Midwest, Ohio Valley, South, Southeast, and Northeast.
During the summer and fall, billion-dollar wildfires dominate across the western U.S. and tropical cyclones raise risks in the South, Southeast, and Northeast.
The rise in billion-dollar disasters is due both to our warming climate and to the growing number of people, homes, and businesses in at-risk areas.

An unprecedented year of billion-dollar disasters
The U.S. was hit with a record 28 billion-dollar weather and climate disasters in 2023. These events resulted in an estimated 492 lives lost and over $93 billion in damages. The previous annual record, 22 disasters, was set in 2020.
Among 2023’s historic number of weather and climate disasters were:
An unprecedented number of severe storms and tornado outbreaks throughout the central U.S.
A devastating fire outbreak in Maui, Hawai’i — the deadliest U.S. wildfire in at least a century.
Southern and Midwestern drought, resulting in extensive agricultural losses and disrupted commerce along the Mississippi River.
Heavy flooding in California following a string of at least 12 atmospheric river storms.
Hurricane Idalia made landfall in Florida, fueled by record-shattering sea surface temperatures.
Heavy rainfall and flooding events in Florida and the Northeast — with some areas reporting up to eight inches of rainfall within 24-hours.
The disasters of 2023 are part of a larger trend. Billion-dollar weather and climate disasters have become more frequent and more costly, bringing different risks to each U.S. region.
Disaster seasons
NOAA has tracked billion-dollar disasters since 1980, across seven event types: droughts, floods, freezes, severe storms, tropical cyclones, wildfires, and winter storms.
Nationwide, tropical cyclones are the most costly type of event. At nearly $1.4 trillion, tropical cyclones account for 52% of all billion-dollar disaster costs since 1980. Severe storms are the most frequent event type, accounting for half of all billion-dollar disasters since 1980.
The 44 years of data show that all states are affected by billion-dollar disasters, and that each U.S. region faces a different set of disaster risks each season. The varied climates, population density, and patterns of land development across the U.S. influence the characteristic mix of disasters in each region.
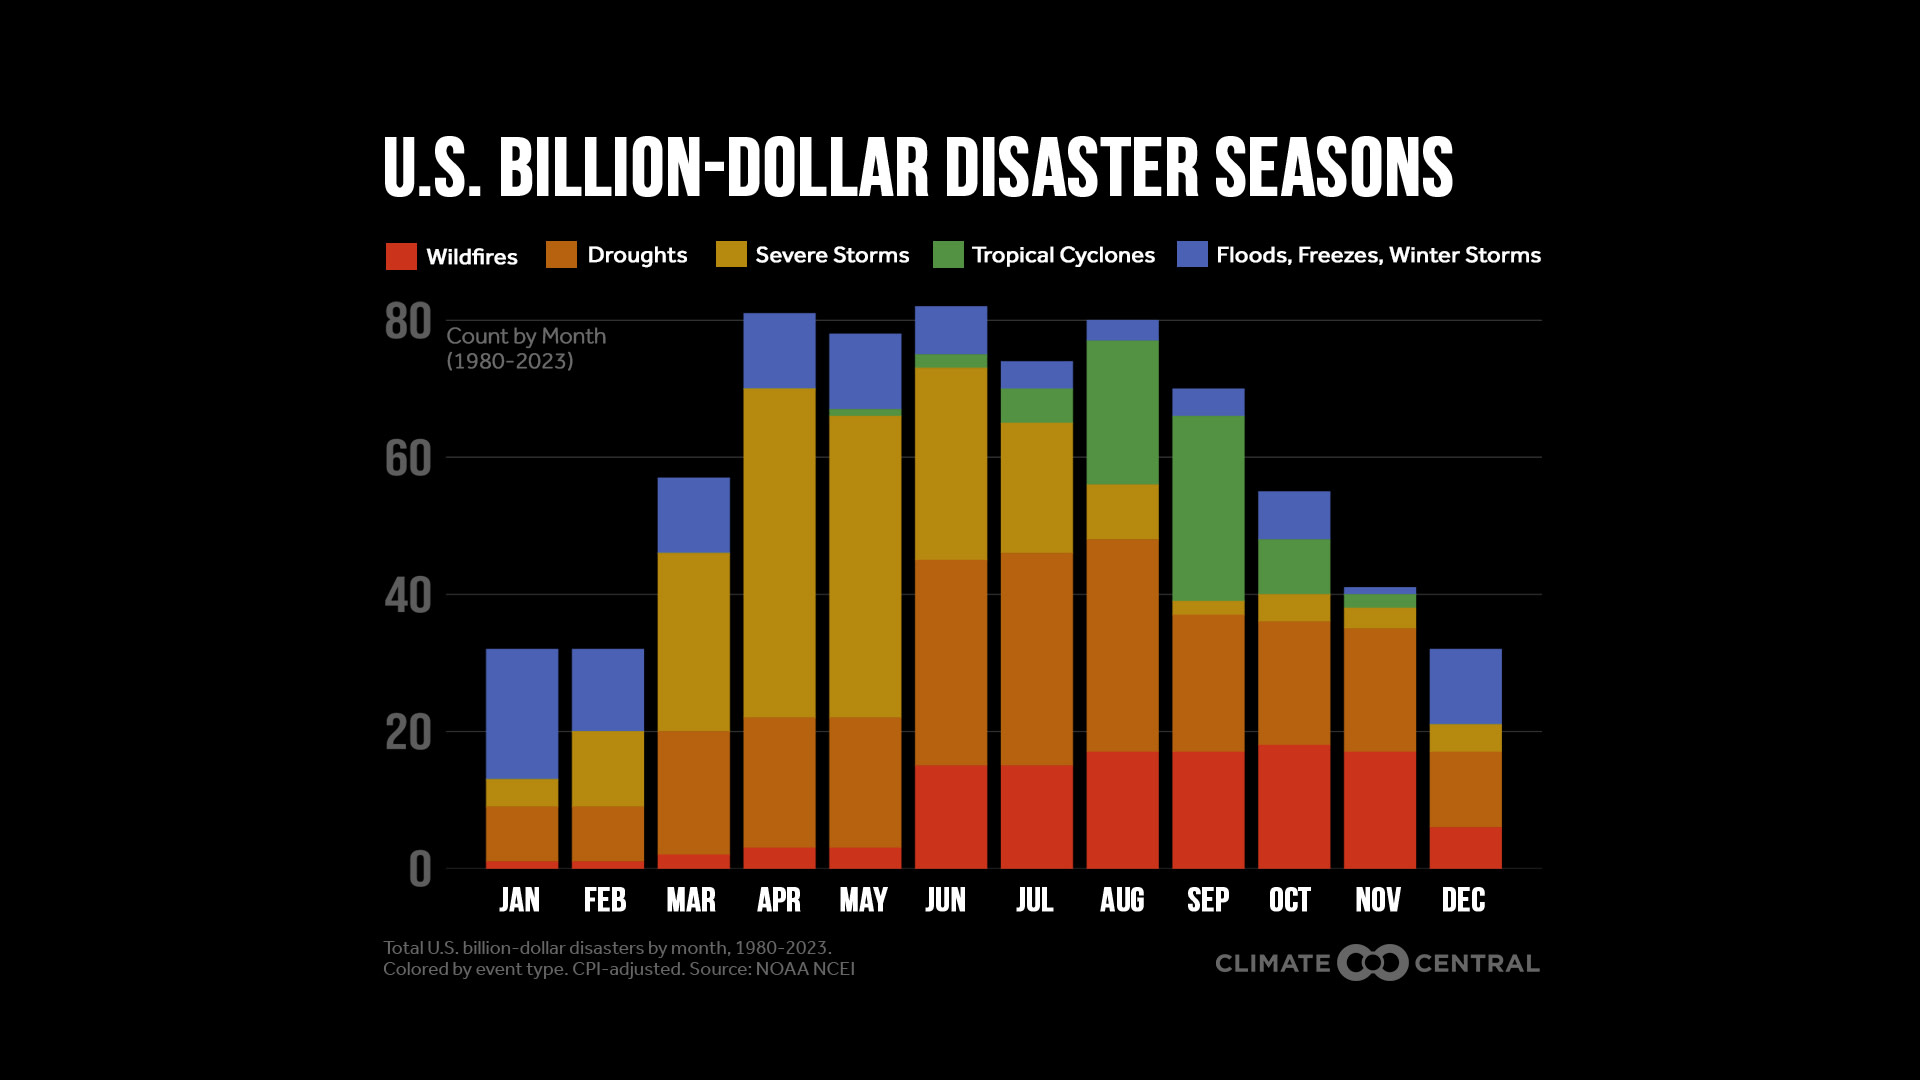
The U.S. tends to experience the most disasters from April through August.
During the spring and summer, severe storms and river floods are generally most common — especially in the Upper Midwest, Ohio Valley, South, Southeast, Northeast.
During the summer and into the fall, wildfires (in the West, Northwest, Southwest, and Northern Rockies and Plains) and tropical cyclones (in the South, Southeast, and Northeast) dominate.
The table below summarizes historical billion-dollar disaster data (1980-2023) for the entire U.S. and nine regions, showing the month with the highest frequency of disasters, as well as the two most frequent disaster types over the entire period of record.
| Region | Top Month | Top Disaster (Frequency), 1980-2023 | Second Disaster (Frequency), 1980-2023 |
|---|---|---|---|
| United States | June | Severe Storm (50%) | Tropical Cyclone (17%) |
| Ohio Valley | April, May | Severe Storm (64%) | Drought (12%) |
| Upper Midwest | May, June | Severe Storm (68%) | Drought (15%) |
| Northeast | April | Severe Storm (55%) | Winter Storm (16%) |
| Northwest | August | Drought (42%) | Wildfire (40%) |
| South | April | Severe Storm (60%) | Tropical Cyclone (12%) |
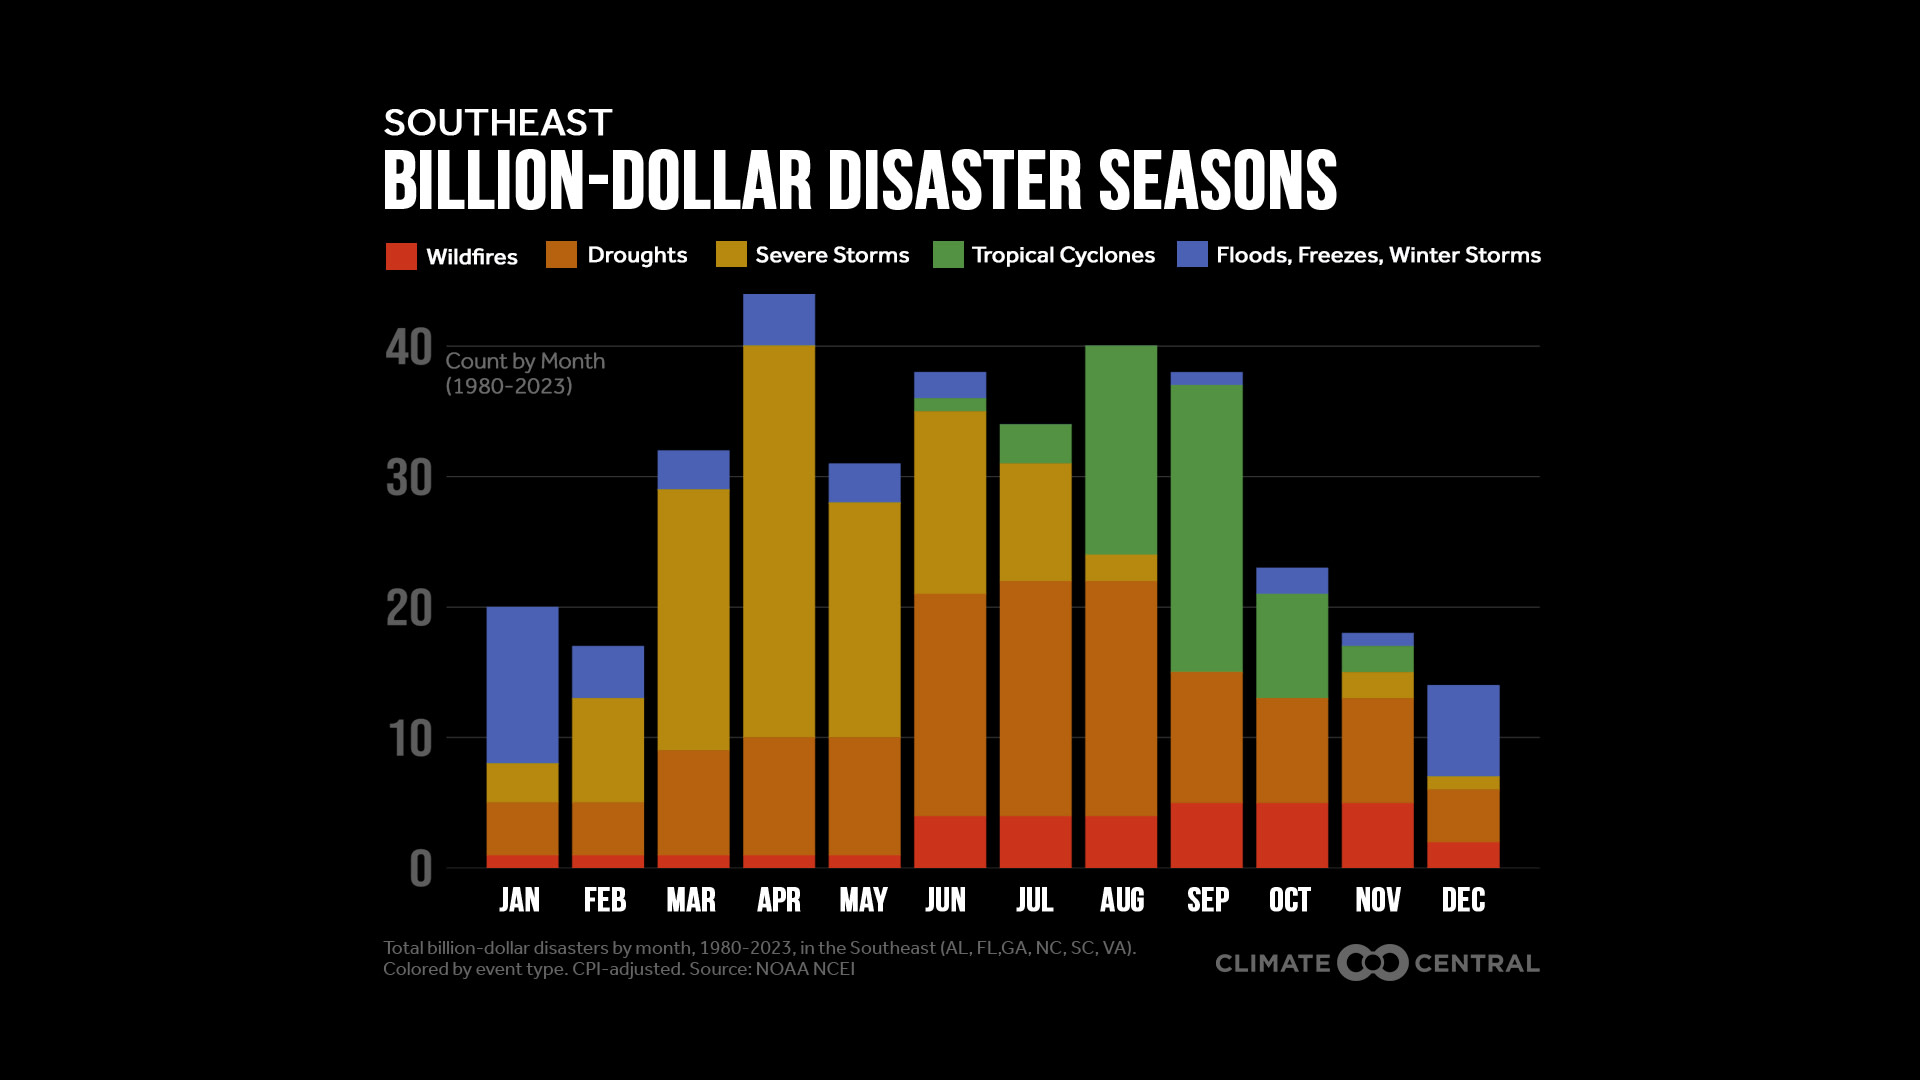
| Southeast | April | Severe Storm (47%) | Tropical Cyclone (24%) |
| Southwest | June | Severe Storm (47%) | Drought (23%) |
| West | October | Wildfire (40%) | Drought (32%) |
| Northern Rockies and Plains | June | Severe Storm (53%) | Drought (19%) |
Compound extreme events
Regional disaster climatologies show that multiple disasters often overlap or occur back-to-back. For example, the Northwest often faces overlapping wildfires and droughts. In the Southeast, the risks of tropical cyclones rise in the summer just as spring severe storms are only starting to taper off.
Overlapping or back-to-back extreme events are known as compound extreme events. We saw compound events in 2020 and 2021, when overlapping droughts and megafires devastated the western U.S. while the eastern U.S. faced back-to-back hurricanes. And in 2023, over a dozen southern and central states faced overlapping impacts from billion-dollar drought and severe storms.
Such compound disasters multiply the risks for communities and strain state and federal emergency response resources. And we can expect more of them in a warming climate, according to the Fifth National Climate Assessment: “Climate change is increasing the chances of multiple climate hazards occurring simultaneously or consecutively across the US and its territories.”
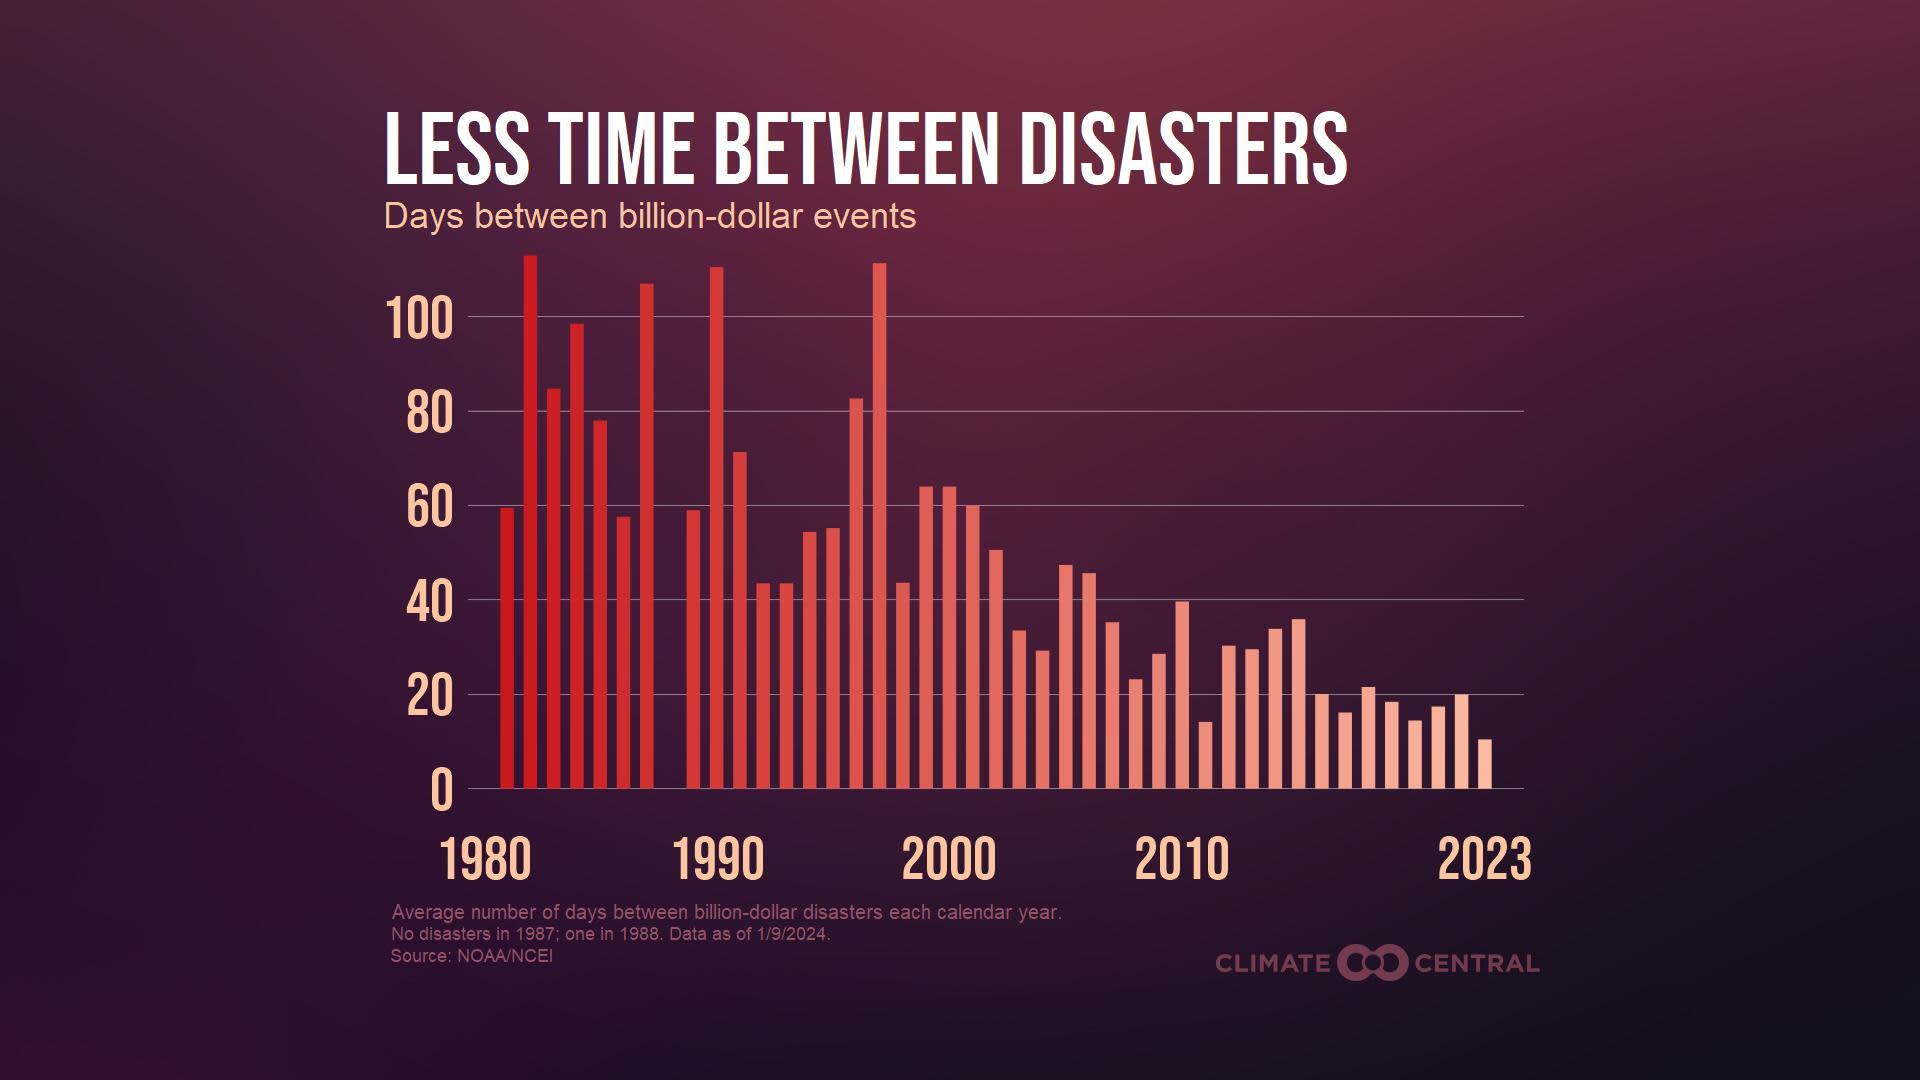
The rise in compound events is also reflected in the dramatic decrease in the time between billion-dollar events. Over the last five years (2019-2023), there were 16 days on average between U.S. billion-dollar disasters, compared to 82 days in the 1980s.
In 2023, the average time between billion-dollar disasters was just 12 days.
Having less time between disasters can mean less time and resources available for communities to respond, recover quickly, and prepare for future risks. Often, these risks aren’t equally shared.
According to the Fifth National Climate Assessment: “Low-income communities, communities of color, and Tribes and Indigenous Peoples experience high exposure and vulnerability to extreme events due to both their proximity to hazard-prone areas and lack of adequate infrastructure or disaster management resources.”
More warming, more extremes, more people at risk
As the planet warms, many dangerous extreme events — from heat waves to wildfires and heavy rainfall and flooding — have become more frequent and/or intense around the globe.
In the U.S., billion-dollar weather and climate disasters have also become more frequent and costly.
Billion-dollar disasters were 2.7 times more frequent over the last 20 years than during the previous 20 years.
Over the same period, the average annual cost of these events has more than tripled from $28 billion per year (1984-2003) to $101 billion per year (2004-2023).
The rise in U.S. billion-dollar disasters reflects a mix of factors:
First, as heat-trapping pollution continues to warm the planet, many types of extreme weather and climate hazards are becoming more frequent and/or more intense in the U.S. and across the globe.
Second, as the population has grown, so has the overall number of people, homes, and businesses at risk when extreme events occur.
Lastly, accelerated development in fire-prone areas, along coasts, and in floodplains can multiply the damage done by a given extreme event.
How does climate change affect key types of billion-dollar disaster events?
Drought: Rising global temperatures are altering the water cycle and increasing the risk of drought in parts of the U.S.
Warming air increases the potential evaporation from the land and transpiration from plants. This process increases the water available for precipitation in some areas but leads to drying in other areas.
For example, while most of the eastern U.S. has generally become wetter since 1900, the western U.S. — especially the Southwest — has experienced drier conditions.
Risks of severe and prolonged megadroughts in the Southwest are projected to intensify over this century with continued warming. As the climate continues to warm, the western U.S. also faces increasing risks of hydrological drought due to declining snowpack and earlier spring melt.
Learn more: Extreme Weather Toolkit: Drought
Flooding: Climate change is bringing heavier rainfall extremes and increased, inequitable flood risk to many parts of the U.S.
For every 1°F of warming the air can hold an extra 4% of moisture, increasing the chances of heavier downpours that contribute to the risk of flash floods.
In the U.S., extreme daily rainfall has become more frequent since the 1980s. Hourly rainfall intensity has also increased since 1970—by 13% on average across 150 U.S. locations analyzed by Climate Central.
From 1958 to 2021, the heaviest 1% of rainfall events became 60% and 45% wetter in the Northeast and Midwest, respectively—and 17-37% wetter for all other regions except the Northwest.
Precipitation extremes are likely to increase globally, even in regions with decreasing average precipitation such as the U.S. Southwest, which is likely to face more intense flash floods with high future levels of heat-trapping emissions.
Learn more: Extreme Weather Toolkit: Heavy Rain and Flooding
Severe Storms: As our climate continues to warm, certain conditions favorable to thunderstorms and tornadoes are occurring more often and severe weather activity is expanding into historically less-active seasons and regions.
Severe storms — thunderstorms that produce tornadoes, damaging wind, and/or hail — are localized events with limited historical records — making it difficult to directly link their occurrence to global climate change. Here’s some of what we do know:
Although the number of tornadoes each year hasn’t changed since 1970 (when excluding the weakest events), tornado variability has increased — concentrated in fewer outbreaks of larger magnitude. And tornado frequency has shifted eastward since 1979, with increased tornadic activity observed in the South, Southeast, and Ohio Valley.
Since 1979, parts of the eastern U.S. have seen up to 15 more days annually with high convective available potential energy during spring and summer—prime time for thunderstorms.
Studies suggest that conditions favorable to severe thunderstorms will become about 5-20% more frequent per 1.8°F of warming. Whether these changing conditions will ultimately result in the formation of more severe storms remains an active area of research.
Learn more: Extreme Weather Toolkit: Severe Weather
Tropical Cyclones: Warming oceans fuel stronger tropical cyclones that bring more heavy rainfall and higher storm surge when they make landfall.
Warming of the surface ocean due to human-caused climate change is fueling an increased proportion of intense tropical cyclones and contributing to an increased fraction of storms that undergo rapid intensification.
Since 1979, human-caused warming has increased the likelihood of a hurricane developing into a Category 3 or higher by about 8% per decade. The latest IPCC reports conclude that the proportion of very intense (Category 4 and 5) tropical cyclones is projected to increase globally with continued warming.
Although the frequency of tropical storms is not necessarily increasing, sea level rise can amplify the storm surge potential when storms do occur, putting coastal residents at particular risk.
Higher tropical cyclone rainfall rates are expected with further warming. Greater rainfall intensity can increase the risk of inland flooding, which accounts for more than half of past U.S. hurricane deaths.
Learn more: Extreme Weather Toolkit: Tropical Cyclones
Wildfire: More frequent hot, dry, windy conditions contribute to more wildfires that put people and ecosystems at risk.
Wildfires can be an ecologically important disturbance. But human-caused climate change, poor land management practices, and sprawling development have increased both the availability of fuel and the frequency of weather conditions that spark and spread dangerous fires.
Regardless of how fires start, more frequent hot, dry, windy conditions affect fuel availability, fire behavior (ignition, duration, and spreading), and can compromise suppression efforts.
According to Climate Central analysis spanning the contiguous U.S. over a 50-year period (1973-2022), wildfire seasons are lengthening and intensifying, especially in the western U.S.
Human-caused climate change accounts for at least two-thirds of the rapid increase in fire weather in the western U.S. in recent decades. And the latest IPCC reports project more frequent fire weather conditions with increased warming.
Learn more: Extreme Weather Toolkit: Wildfire
LOCAL STORY ANGLES
How are Billion-Dollar Disasters impacting your state or county?
NOAA’s Billion-Dollar Disasters data visualization tools offer insights:
Explore the frequency and cost of billion-dollar weather and climate events in your state.
Understand risk and vulnerability in your county or state by looking at weather and climate risk, socioeconomic vulnerability and future risk.
Breakdown your state’s climatology and the historical disaster risks faced each season.
CONTACT EXPERTS
Adam B. Smith
Applied Climatologist
Center for Weather and Climate, National Centers for Environmental Information (NCEI)
Related expertise: Lead scientist for NOAA’s U.S. billion-dollar weather and climate disasters research (https://www.ncei.noaa.gov/access/billions).
Contact: Adam.Smith@noaa.gov
Deepti Singh, PhD (she/her)
Assistant Professor
Washington State University
Related expertise: Compound extreme events
Contact: deepti.singh@wsu.edu
FIND EXPERTS
Submit a request to SciLine from the American Association for the Advancement of Science or to the Climate Data Concierge from Columbia University. These free services rapidly connect journalists to relevant scientific experts.
Browse maps of climate experts and services at regional NOAA, USDA, and Department of the Interior offices.
Explore databases such as 500 Women Scientists, BIPOC Climate and Energy Justice PhDs, and Diverse Sources to find and amplify diverse expert voices.
Reach out to your State Climate Office or the nearest Land-Grant University to connect with scientists, educators, and extension staff in your local area.
METHODOLOGY
All U.S. billion-dollar weather and climate disasters data are from: NOAA National Centers for Environmental Information (NCEI) U.S. Billion-Dollar Weather and Climate Disasters (2023). https://www.ncei.noaa.gov/access/billions/ (DOI: 10.25921/stkw-7w73).
All billion-dollar disaster cost estimates included in this Climate Matters are CPI-adjusted.
The time between U.S. billion-dollar disasters was calculated by measuring the time between the start date of each disaster as recorded by NOAA/NCEI. The difference in days was only for calendar year events, with the first event of the calendar year set as the first date. For this reason, there are no data points for 1987 and 1988, which had zero events and only one event, respectively.